
2022
This page is also available at raypalin.org/2022-song-psychology-throughout-history
Song Psychology Throughout History
Introduction — by the Teacher
The 2022 project, which was shaped by an appreciable interest in music among several students, examines the psychology of song lyrics. While similar to the 2021 project, which looked for particular themes and positive or negative tone within historical documents, this year's project sought to measure a wider array of sentiment, including self-focus and social connectedness. Relying on the output of the free version of LIWC, the Linguistic Inquiry and Word Count analysis software developed at the University of Texas, students developed psychological profiles for songs and evaluated the profiles relative to their historical contexts.
Before examining songs historically, the class first looked at song lyrics more generally. In order to become familiar with the LIWC instrument, students compared psychological markers present within three music genres: grunge, reggae, and country. Using lists of top songs found on the web, along with other lists subjectively assembled to include songs most representative of each genre, the class found some expected and unexpected results. Although, based on LIWC output, aspects of each psychological profile seemed to largely coincide with each genre’s fundamental characteristics (e.g., a protest spirit within reggae (moralization and social words) or anti-social cynicism associated with grunge (i-words and negative tone)), it became clear that individual songs can be clear outliers. The grunge genre, for example and as expected, scored above average in negative tone and below average in social words. But the popular Nirvana song “Smells Like Teen Spirit” greatly defied expectations, scoring extremely high in positive tone and thereby elevating the overall genre unexpectedly in this category. The song’s repeated use of the word “hello” apparently overloaded LIWC dictionaries with contrary indicators and tricked the LIWC algorithm into classifying Nirvana's language as emotionally positive. These findings, discovered by students and illustrated by students in the following graphs, set the stage for additional and more historical investigations that also appear below.
 Completed by Nick P. Completed by Nick P. |
 Completed by Nick P, Cam, Sam, Brynn, and Jonah. Completed by Nick P, Cam, Sam, Brynn, and Jonah. |
 Completed by Nick B and Emma. See other graph. Completed by Nick B and Emma. See other graph. |
Individual Student Research

Comparing 1948, 1958, and 1968 — For our individual projects, our group compared the top twenty songs from three different years using Billboard. We chose the years 1948, 1958, and 1968, in an attempt to discover a growing counterculture and turn-to-rebellion movement in the late-50s and early-60s, as reflected in song lyrics. 1948, we reasoned, would represent the homogeneous post-war period, in which we expected song lyrics to display high positive tone and social words, while displaying a low negative tone. We then chose 1958 because it marked the beginning of the space race, which played a major role in the Cold War. We expected this to show a somewhat higher negative tone, but overall closer to the averages. Additionally, we chose 1968 because it was the height of Vietnam, with the Tet Offensive gaining major backlash in the U.S. We expected this to show very high negative tone and moralization, while showing a low positive tone. Each person then chose a specific year, and ran the songs separately through the LIWC analysis in an attempt to find any outliers. We then compared the data using averages for each list (see bar graph). Using our data, we discovered that there was no major difference between 1948 and 1968, which was a surprise based on the historical events that occurred during these years. The one notable outlier is 1958, which is lower than the other two years in more than half of the categories (i.e. I-words, Positive tone, and Negative tone). However, our prediction for the year was mostly right: it was the closest to the LIWC average for music. Yet, it did have a lower negative tone, which could be attributed to the nuclear-family era which had a booming economy. 1948 does make sense historically with the positive tone being higher than average. 1948 was a post-war era filled with positivity and patriotism. However, the most confusing year was 1968, which showed a positive tone that was well above the LIWC average and beyond the other years we analyzed, which were historically happier periods of time. One speculation for this is that music is seen as a sense of hope or happiness in such a dark period. Furthermore, there was a “silent majority” of Americans who were against the counterculture and wanted a more homogeneous and drug-free society, which could have had an effect on music lyrics at the time. Additional data visualizations: graph 1, graph 2, graph 3. — by Nick P., Cam, and Brynn
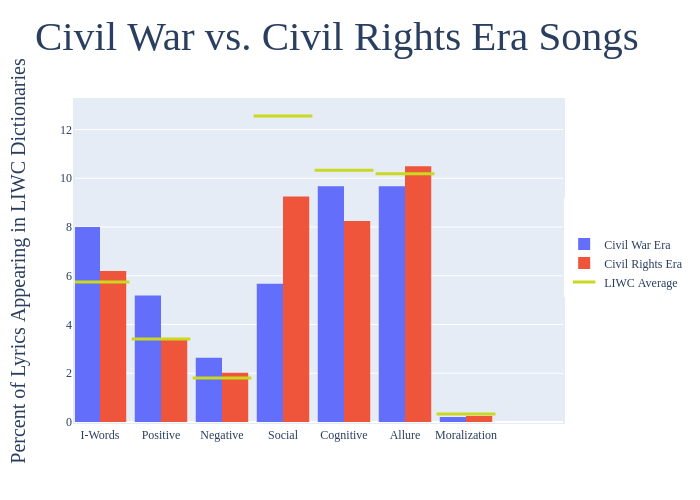
Songs of the Civil War and the Civil Rights Era — For our individual research we used the LIWC analysis app to analyze African-American protest music from both the Civil War and Civil Rights eras; we selected 10 songs from each era that were representative of the black population at the time. Focusing on specific categories, including positive tone, negative tone, social words, and moralization, we hoped to find similarities and differences in the song lyrics based on historical characteristics of the two eras. As shown in the Civil Rights vs Civil War era music graph, the data yielded some unexpected results. One of the more confusing results was the lower negative tone than positive tone averages for both eras. Since both the Civil War and Civil Rights eras historically reflected negative times for the black population, we expected the negative tone to greatly outweigh the positive tone. Another source of confusion was the unexpectedly low moralization numbers, given that Negro spiritual music in the 19th Century was historically hopeful. This could have contributed to the positive tone outweighing the negative tone in our graph. The Negro spiritual music contained 29% more positive tone than music from the Civil Rights era. This makes sense as Negro spiritual music tended to serve as a source of hope and inspiration, whereas Civil Rights era music tended to be critical and protestive. Another result that we anticipated was a higher use of social words in lyrics from the Civil Rights era than in the lyrics of the Civil War era. Civil Rights music tended to be directed at social and political change, whereas Negro spiritual music was less radical and more focused on adapting to environments. Thus, as expected, our data showed Civil Rights lyrics possessing approximately 40% more social words than the lyrics of the Civil War era songs. Although, even though social words were used significantly more often in that era, our 9.254 score average for Civil Rights lyrics still falls below the LIWC 12.55 average for all music. Despite some of the anticipated results from the social words, the results from other categories, such as moralization and negative tone, defied expectations. — by Jonah and Sam

East Coast and West Coast Hip Hop — Following the Civil Rights movement of the 1950s and 1960s, and following cuts to Great Society programs during the Reagan administration of the 1980s, African Americans found themselves in worsening economic and social conditions. The combination of white flight, decreasing economic opportunities, and a deepening of the wealth divide caused a surge in anti-establishment, negative sentiments in urban communities. Those who spoke out, with song, started to spread their message through the emergence of hip hop. The 1990s were known as the most influential decade of hip hop, specifically the year 1996. Within this decade the genre faced a huge divide and rivalry between West Coast and East Coast rap. For my individual project I chose to analyze the difference in lyrical sentiments between East and West Coast rap, hoping to see a difference in sentiment. To achieve my findings I used the LIWC word analysis tool to determine the overall sentiment in each category. I found the average of each style of rap by plugging in the lyrics of the top 5 songs of the year 1996 for each style into LIWC. After expecting there to be a greater difference in sentiment, it was surprising to see that the two styles of rap were generally very similar based off of the LIWC dictionaries. The one thing that stood out was the significant difference in percentage of social words in East Coast rap. East Coast rap showed 16.14% of social word use, compared to the West Coast’s 7.54% social words. After re-analyzing the songs that I chose for the East Coast genre, I found that the high score on the social words was mainly based off of one song swaying the results. The song "Shimmy Shimmy Ya" made the social word percentage of East Coast rap increase significantly. After eliminating that song and then re-analyzing the text, the percentage of East Coast rap returned back to a very similar percentage as West Coast rap. After completing this analysis it further proved the point that there are some outliers that can skew the results in the LIWC dictionary. — by Emma

Protest Songs During the Vietnam War — To understand the sentiment of anti-war protesters during the Vietnam War, I chose to analyze anti-war songs from the years 1965 through 1972 and see which was the most negative year. To help illustrate this I made a graph showing the negative tone and positive tone in the songs over the chosen years. I picked 1965 as the start date since it was one year after the escalation of the war and allowed for songs to be produced, and I chose 1972 as the end date because it was three years after Nixon entered office, and the announcement of Vietnamization. I chose five songs from each year and analyzed them to understand which year was the most negative, and the most positive. I expected for the graph to show a steady increase in negativity, and eventually a decrease in the later years when soldiers were pulled out. 1970 as a low year is somewhat expected because of Nixon’s election and the announcement of Vietnamization helping to calm the tension. 1969 and 1971 make sense for the two highest years because of events such as Woodstock in 1969 and the Tet Offensive in 1968, and the Pentagon Papers being leaked in 1971. The positive tone in the songs showed no definitive pattern and lacked data to draw conclusions. This could be due to the LIWC software not picking up on sarcasm, slang, or songs calling for peace being portrayed as positive. — by Nick B.
About Us
"Song Psychology Throughout History" is the product of the 2021-2022 AP U.S. History class: Nick Belisle, Jonah Flint, Sam Flint, Emma McNally, Cam Messenger, Nick Pollari, and Brynn Smith.

